
Publications FATC 2026 · #128
Conference poster · FATC 2026 · #128
Evaluation of Anti-Scaling Additive on CaCO3 Deposition Under Simulated Oil Well Conditions
1 Industrial Technology Department, Federal University of Espírito Santo (UFES), Brazil · 2 BrazFlow Labs, UFES startup, Brazil · * fabio.a.pereira@ufes.br
Presented at the SPE Brazil Flow Assurance Technology Congress — FATC 2026 · Rio de Janeiro, November 4–6, 2026
Page link: www.brazflow.com/posters/fatc-128/
Analysis
About this work
Objective
To test whether a phosphonate antiscalant controls CaCO3 scaling when precipitation is driven by CO2 degassing — the mechanism behind carbonate scale in pre-salt wells — and how the presence of crude oil changes the result.
Approach
Three runs in our HPHT rotating-cage reactor with the same brine, temperature and depressurization: a reference, one with 20 mg/L of antiscalant, and one with antiscalant plus 300 mL of crude oil. Deposits were evaluated by mass (gravimetry), crystal morphology (optical microscopy) and adhesion (scratch test).
What we found
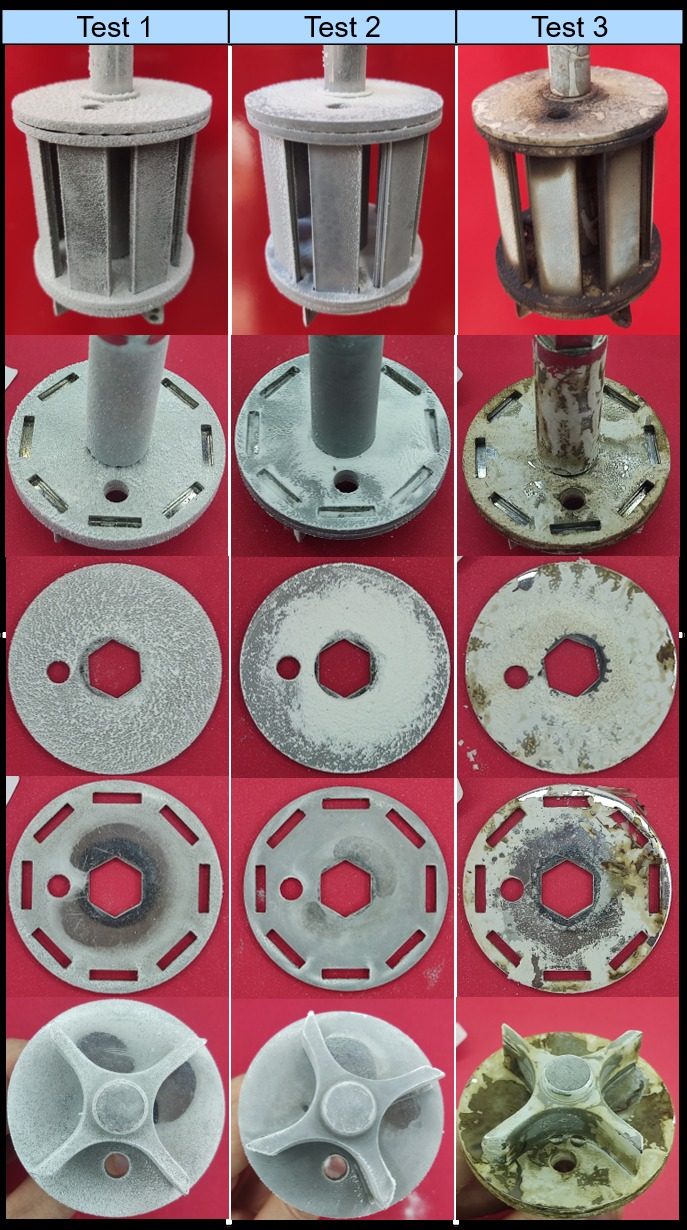
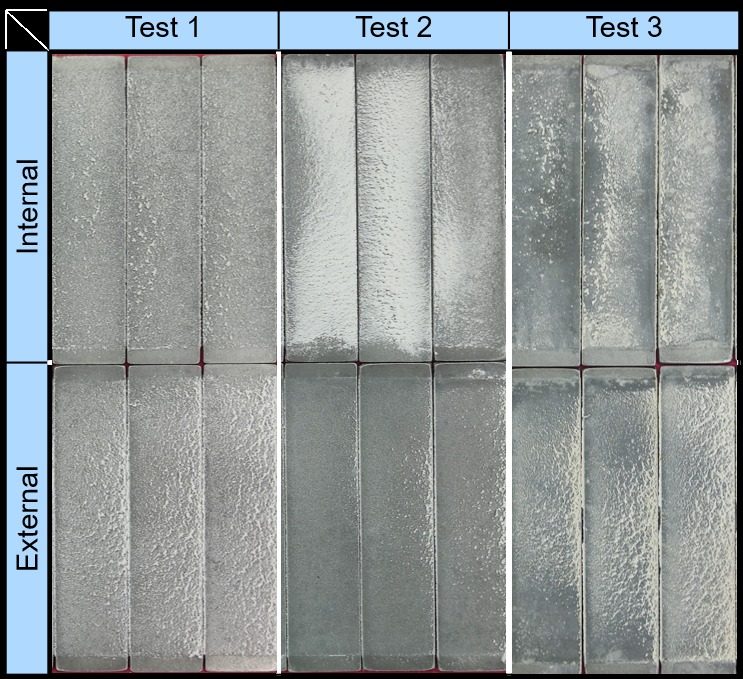
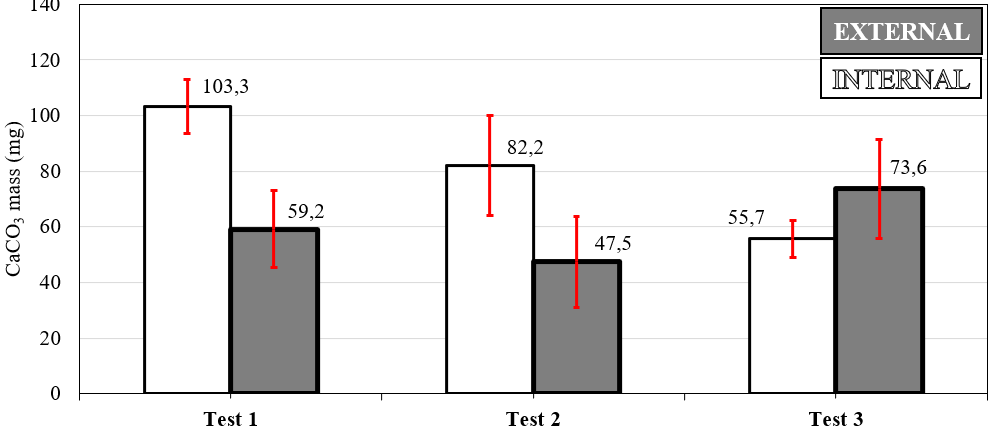
- The antiscalant reduced the CaCO3 mass by about 20% on both internal (103.3 → 82.2 mg) and external coupons (59.2 → 47.5 mg), and the cage came out visibly cleaner.
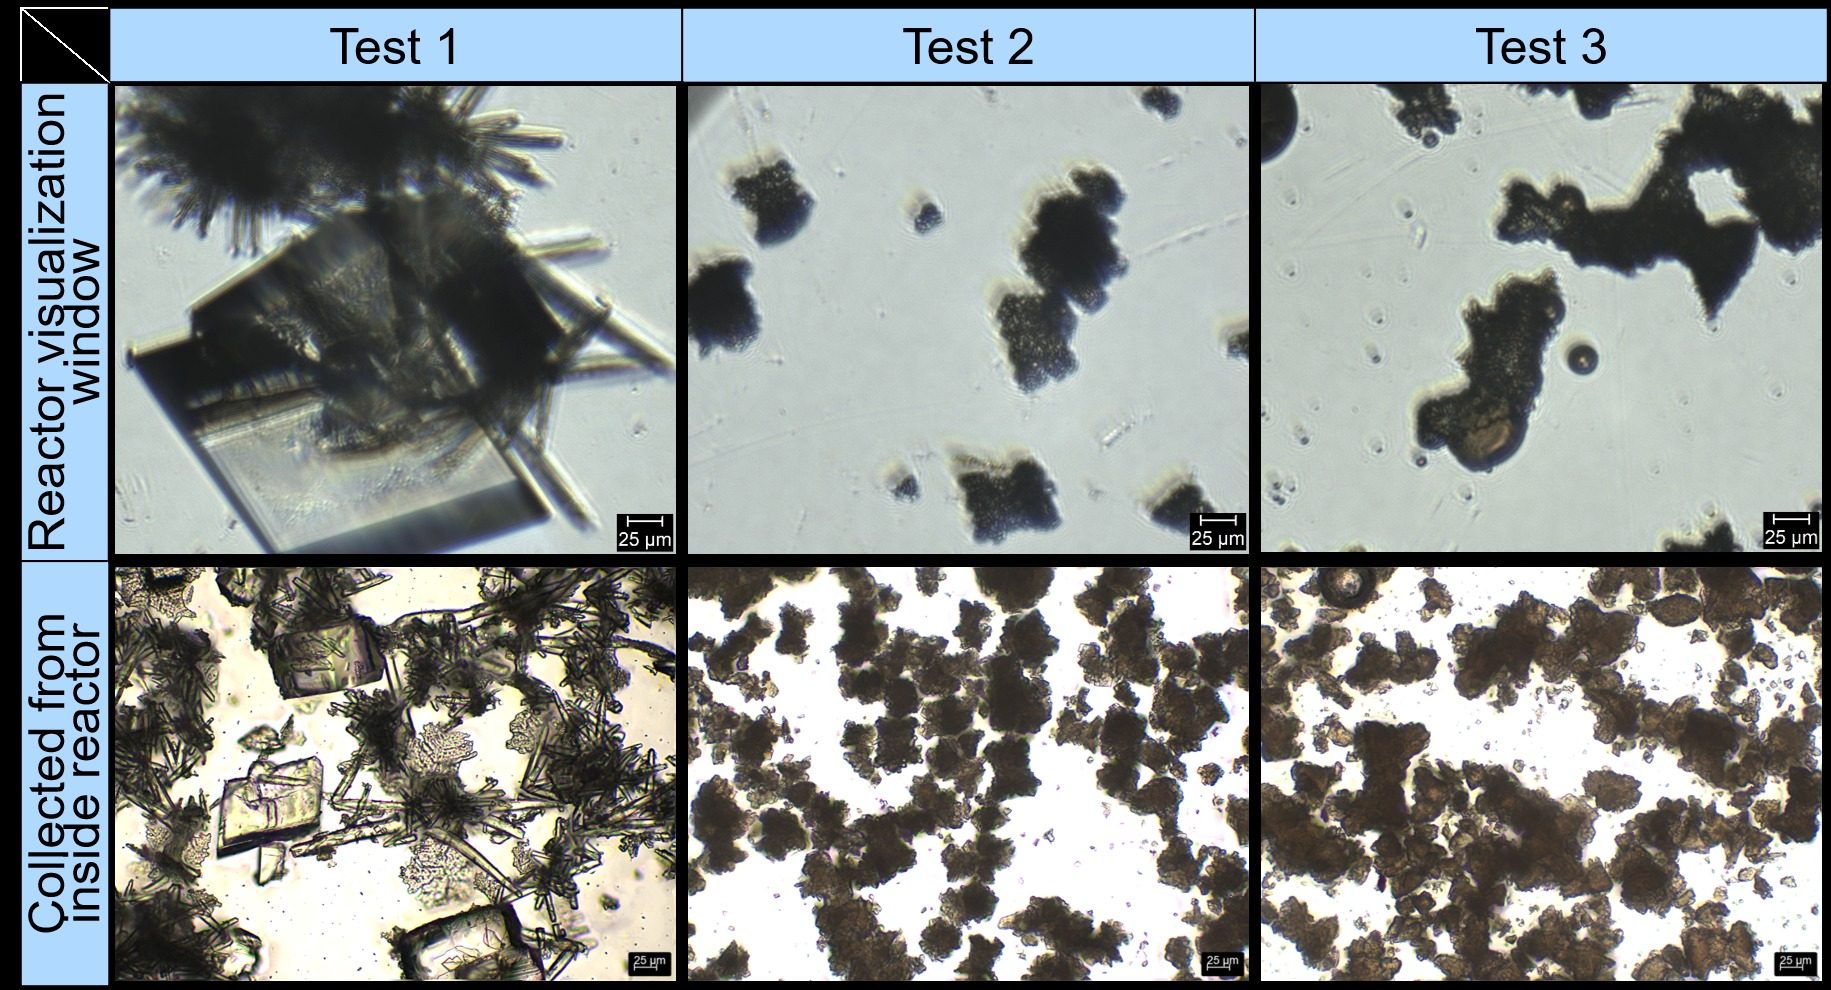
- It delayed precipitation: without additive, crystals appeared at ≈30 bar during depressurization; with the antiscalant, only after reaching 1 atm.
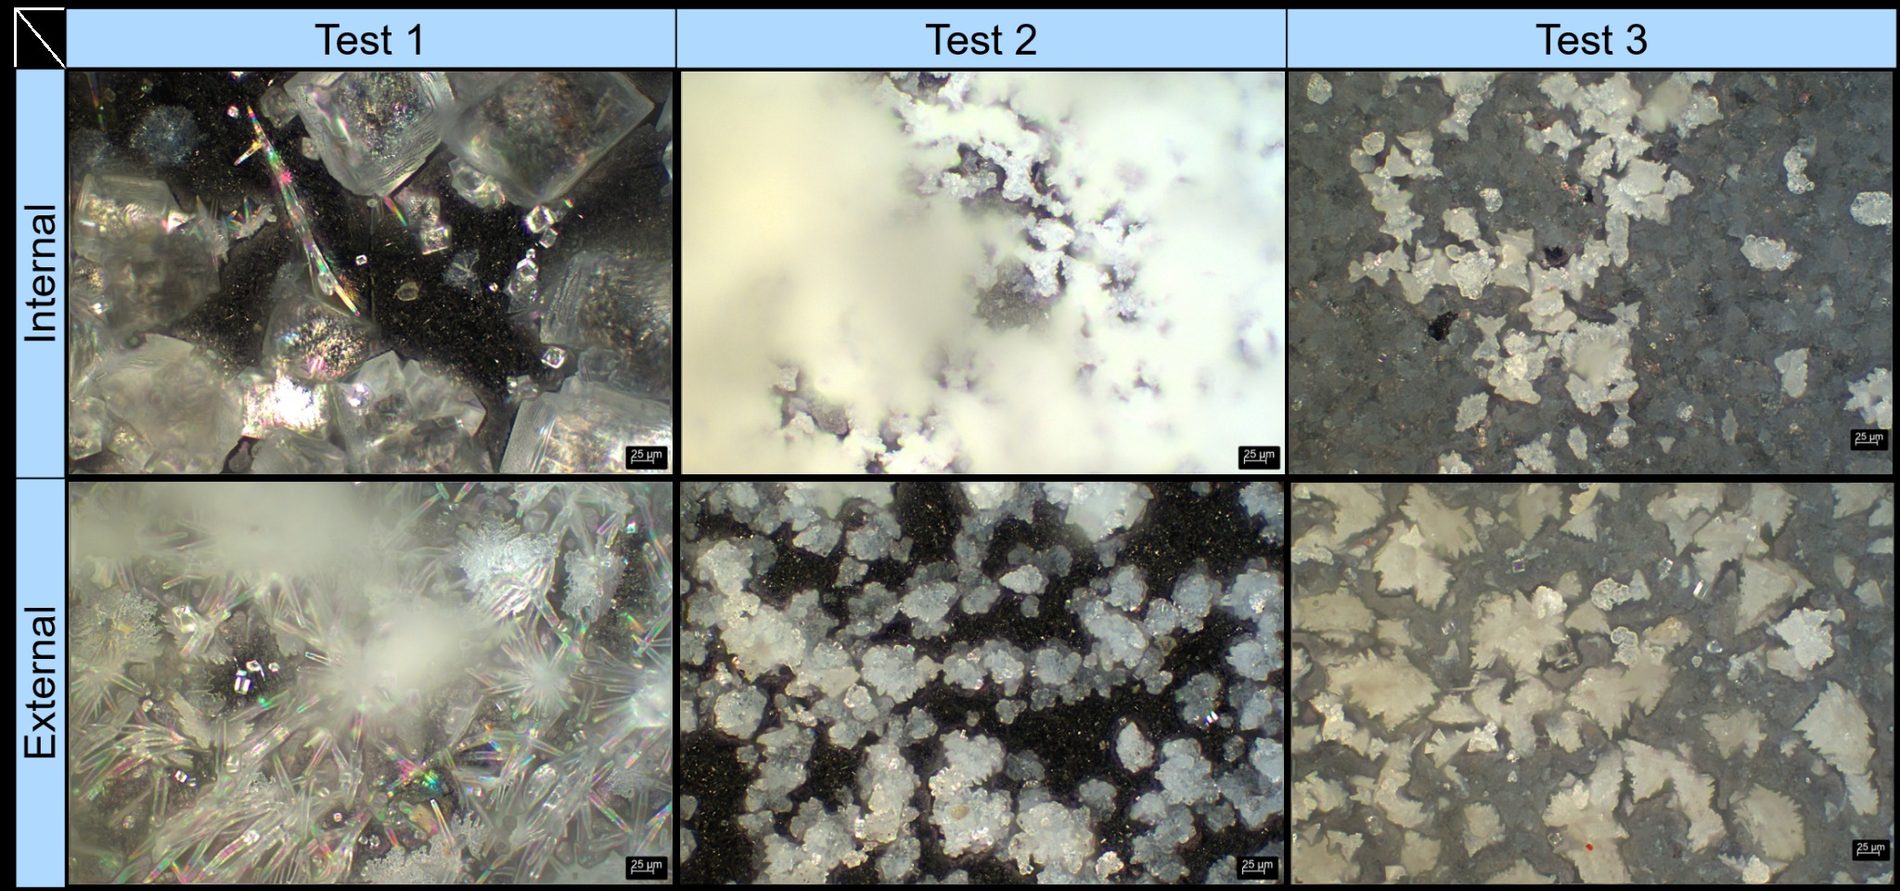
- It changed the crystals: smaller, irregular particles instead of the large, well-formed crystals of the reference test.
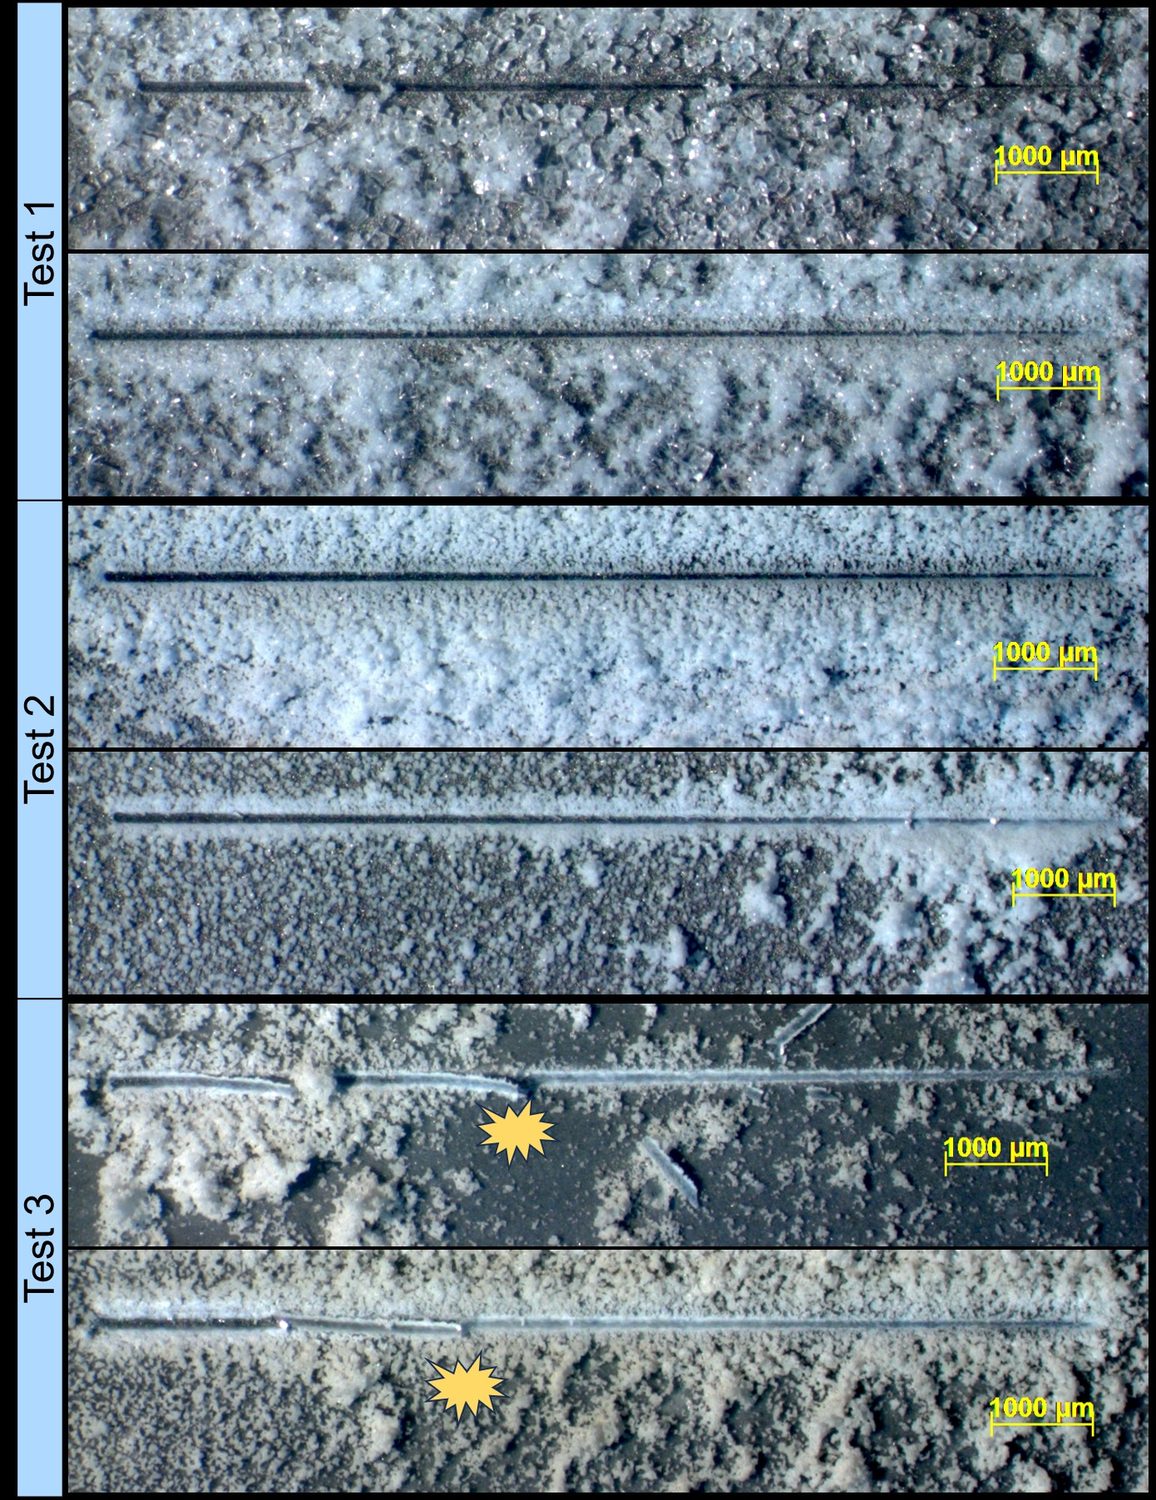
- With crude oil, internal coupons collected less CaCO3 (55.7 mg), while external coupons collected 73.6 mg; the deposit formed heterogeneous aggregates and adhered strongly — in the scratch test the film only detached at ≈7 N, whereas the indenter quickly reached the steel in tests 1 and 2.
Why it matters
Antiscalants are usually ranked by how much deposit they prevent. Under realistic HPHT conditions with oil, a smaller deposit mass came together with a deposit that is much harder to remove. Morphology and adhesion should therefore be part of antiscalant qualification — not only mass.
Experimental setup
Experimental conditions and tests performed
Tests performed
| Test | Antiscalant (20 mg/L) | Crude oil (300 mL) | CaCO3 internal (mg) | CaCO3 external (mg) |
|---|---|---|---|---|
| 1 — Reference | — | — | 103.3 | 59.2 |
| 2 — Antiscalant | ✓ | — | 82.2 | 47.5 |
| 3 — Antiscalant + oil | ✓ | ✓ | 55.7 | 73.6 |
Average CaCO3 mass per coupon (8 coupons per position), from Figure 3.
Test conditions
- Reactor
- HPHT rotating-cage reactor
- Coupons
- 16 × AISI 316L (internal and external positions)
- Rotation
- 125 rpm (Re ≈ 37,685)
- Temperature
- 80 °C
- Gas
- Solution A saturated with 50 bar of CO2
- Ca2+ injection
- Solution B injected with N2 (+40 bar)
- Trigger
- 1 h depressurization → CO2 degassing → CaCO3 precipitation
- Volumes
- Solution A 2,750 mL · Solution B 250 mL
- Antiscalant
- Phosphonate, 20 mg/L
- Crude oil
- 300 mL (test 3)
Solution composition
| Reagent | Sol. | Sol. (mg/L) | Mixture (mg/L) |
|---|---|---|---|
| NaHCO3 | A | 6,873 | 6,301 |
| CaCl2·2H2O | B | 66,160 | 5,513 |
Final mixture — ions
| Ion | Mixture (mg/L) |
|---|---|
| Na+ | 1,724 |
| HCO3− | 4,576 |
| Cl− | 2,659 |
| Ca2+ | 1,503 |
Analyses
- Gravimetry — CaCO3 mass on internal and external coupons
- Optical microscopy — reactor viewing window, solution collected from the reactor and coupon surfaces
- Scratch test — progressive load from 0.5 to 10.5 N to assess deposit adhesion
- Precipitation onset — observed through the reactor window during depressurization
From the poster
Poster figures
Select a figure to open it at full size.
From the lab
More images from the tests
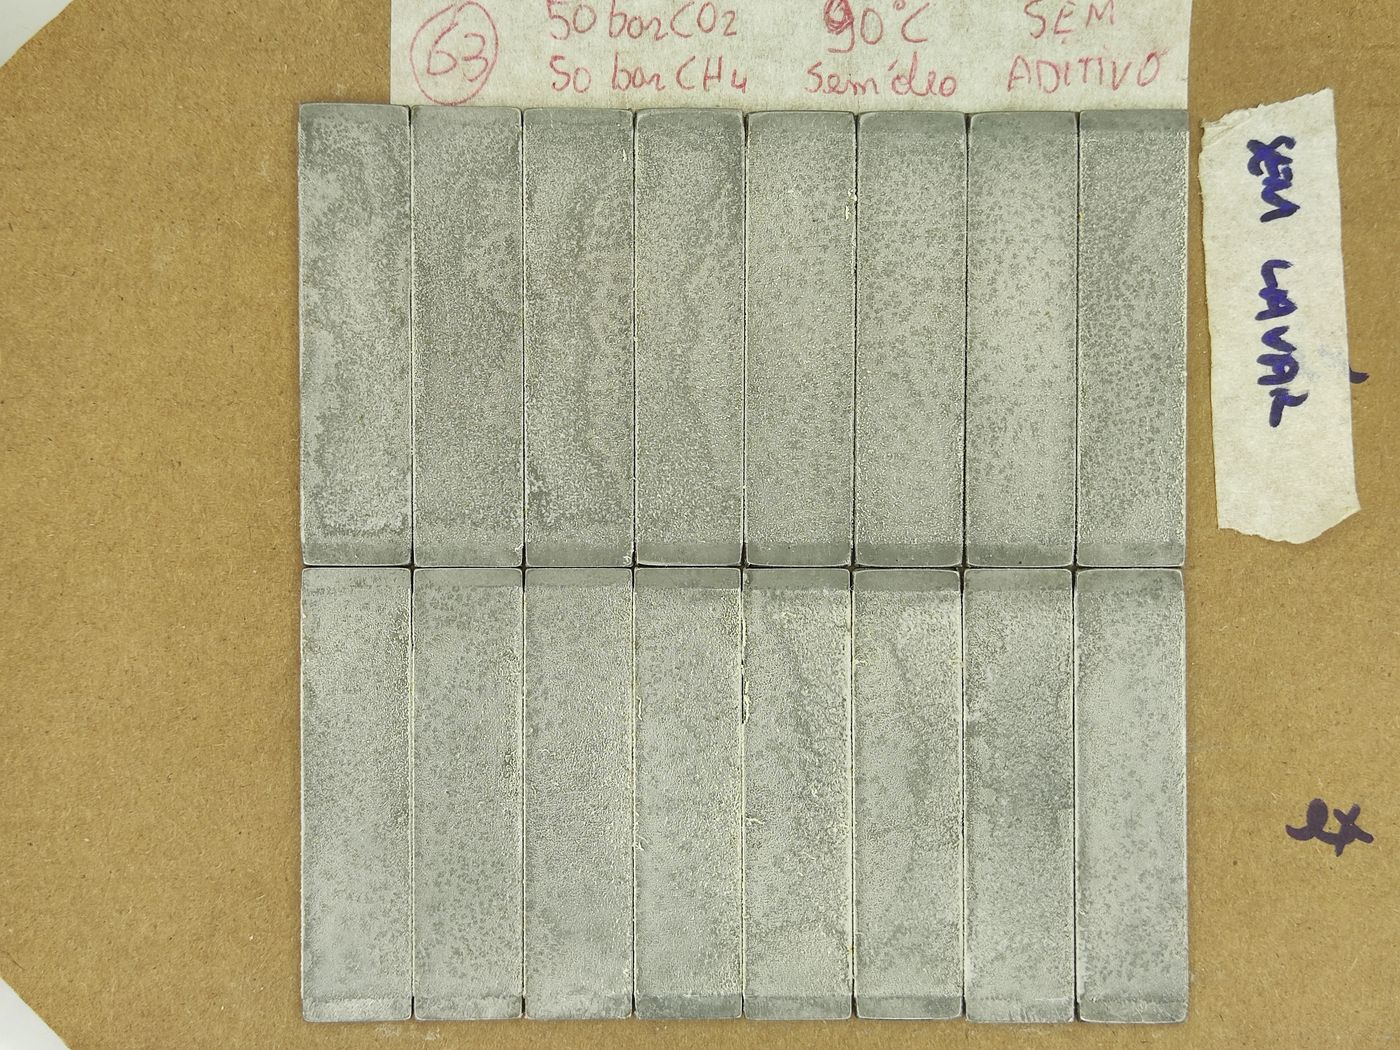
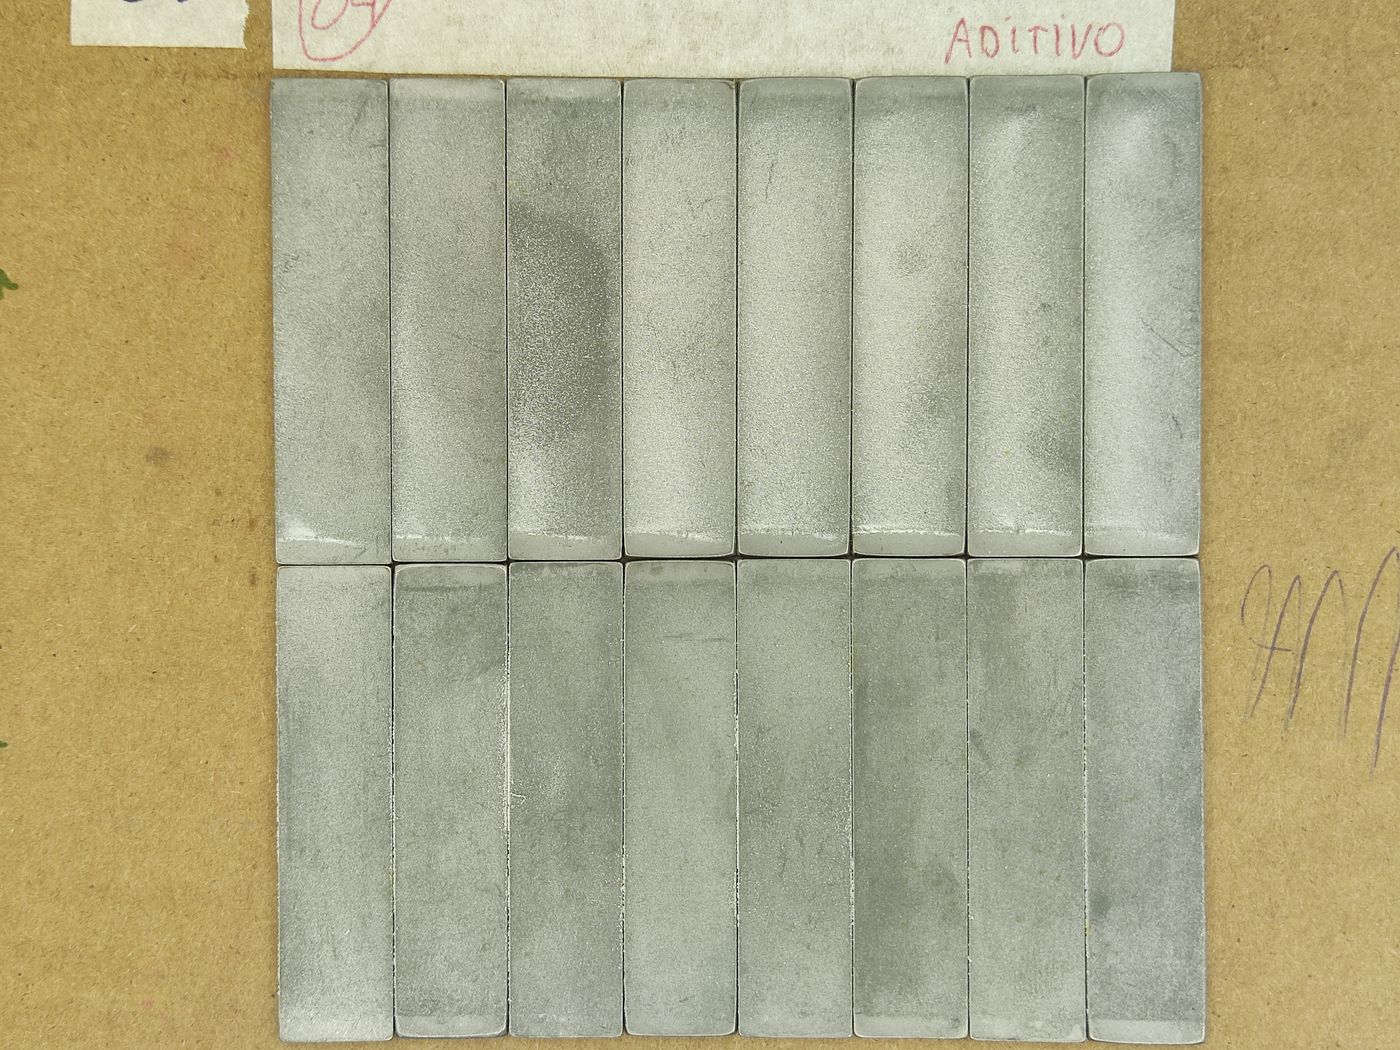
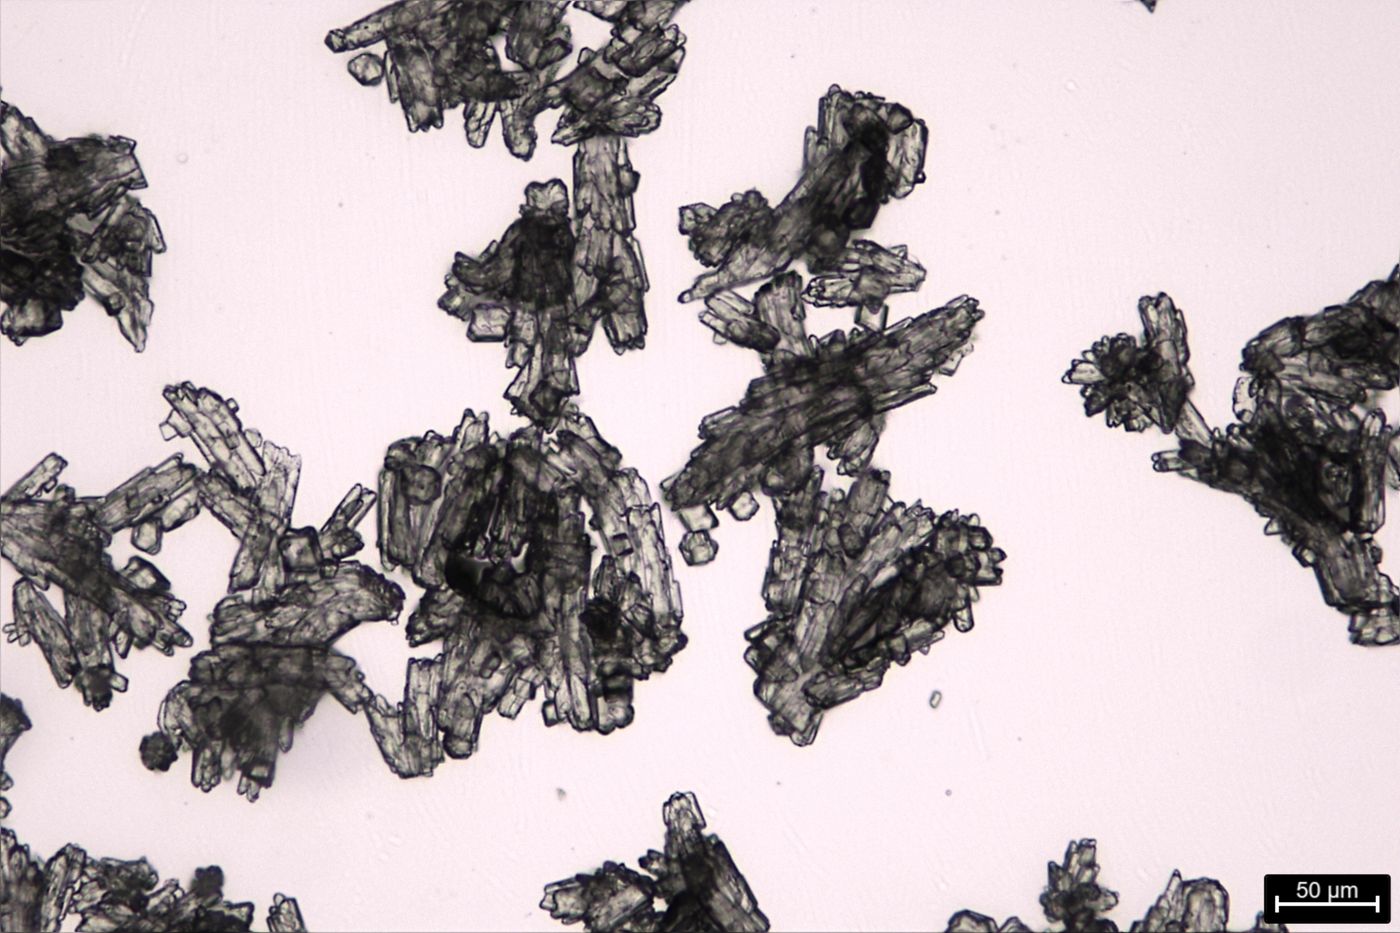
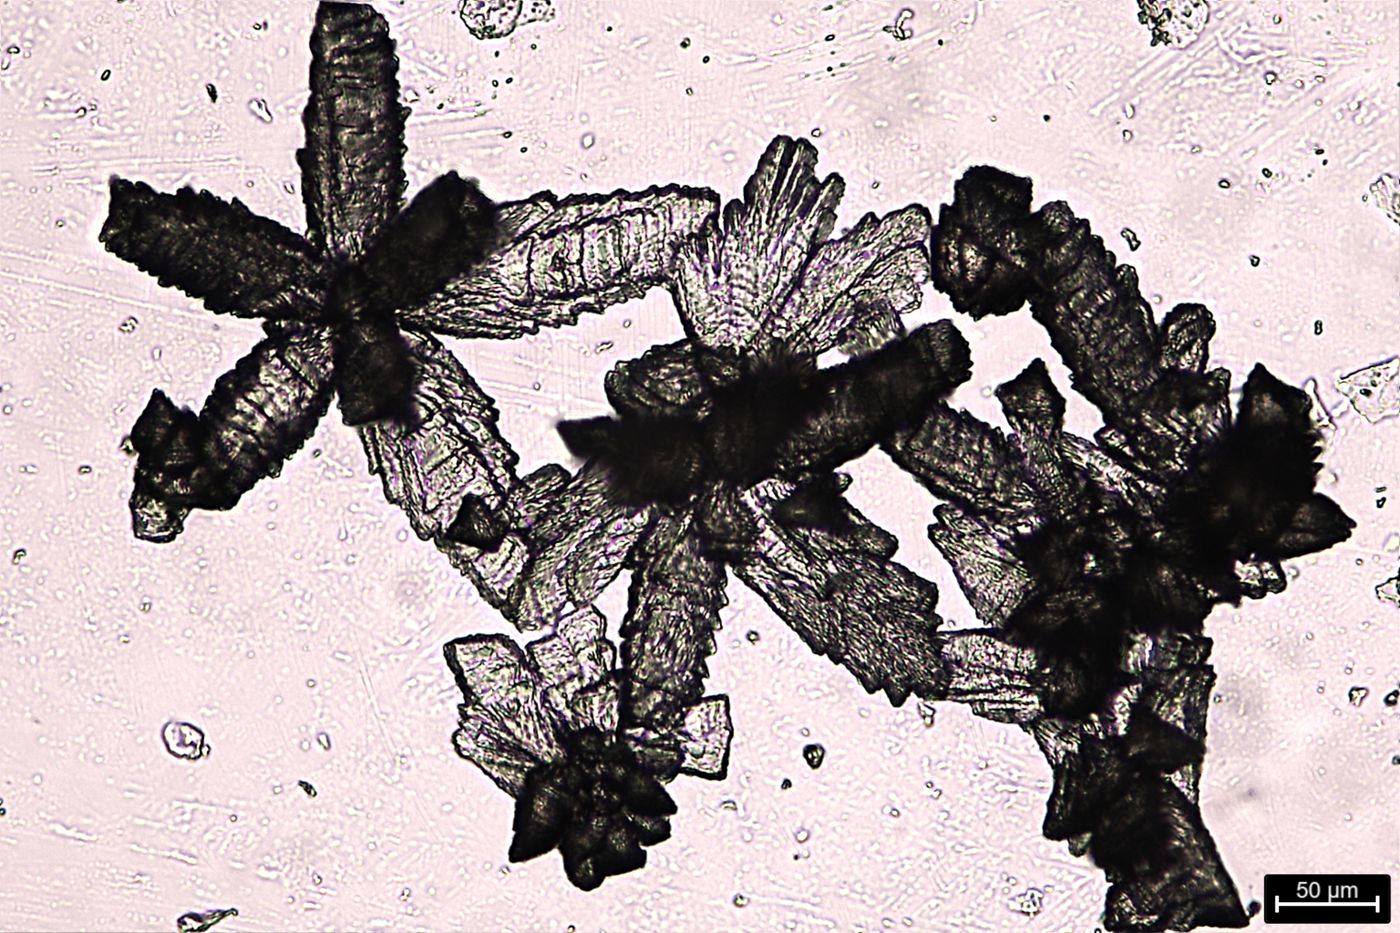
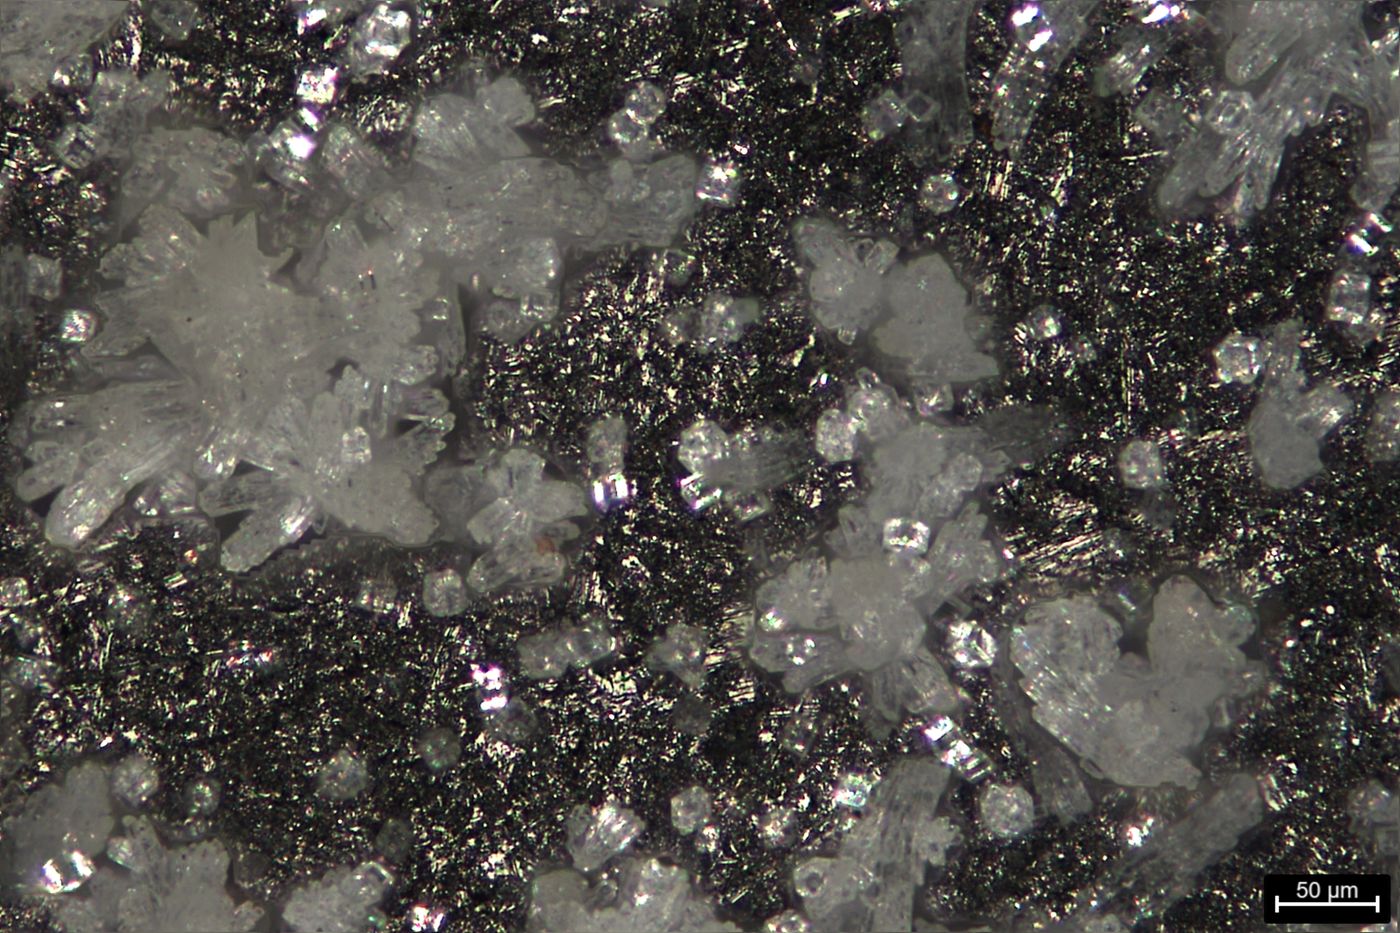
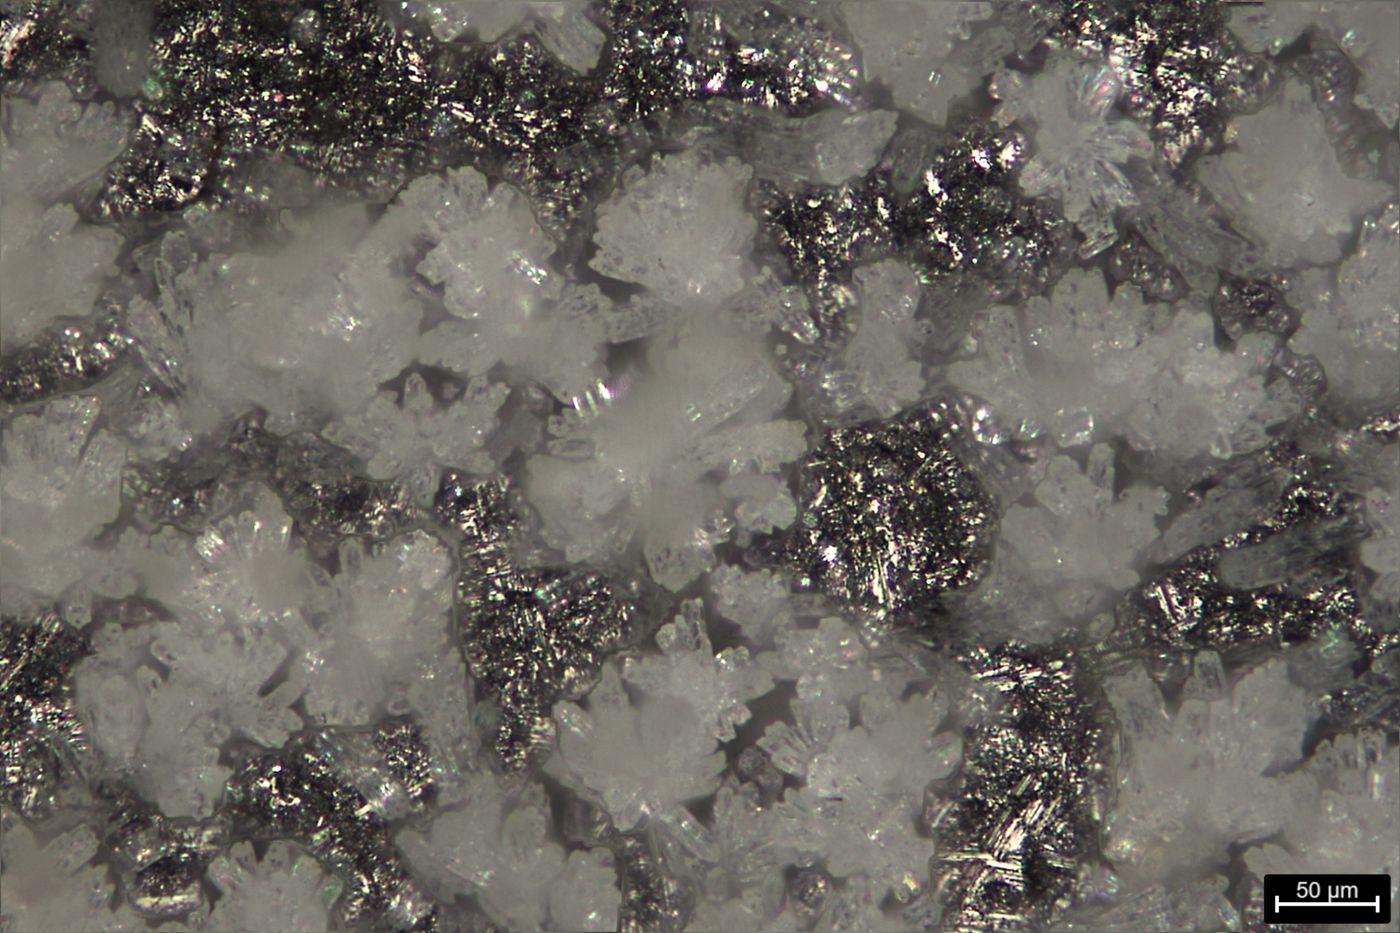
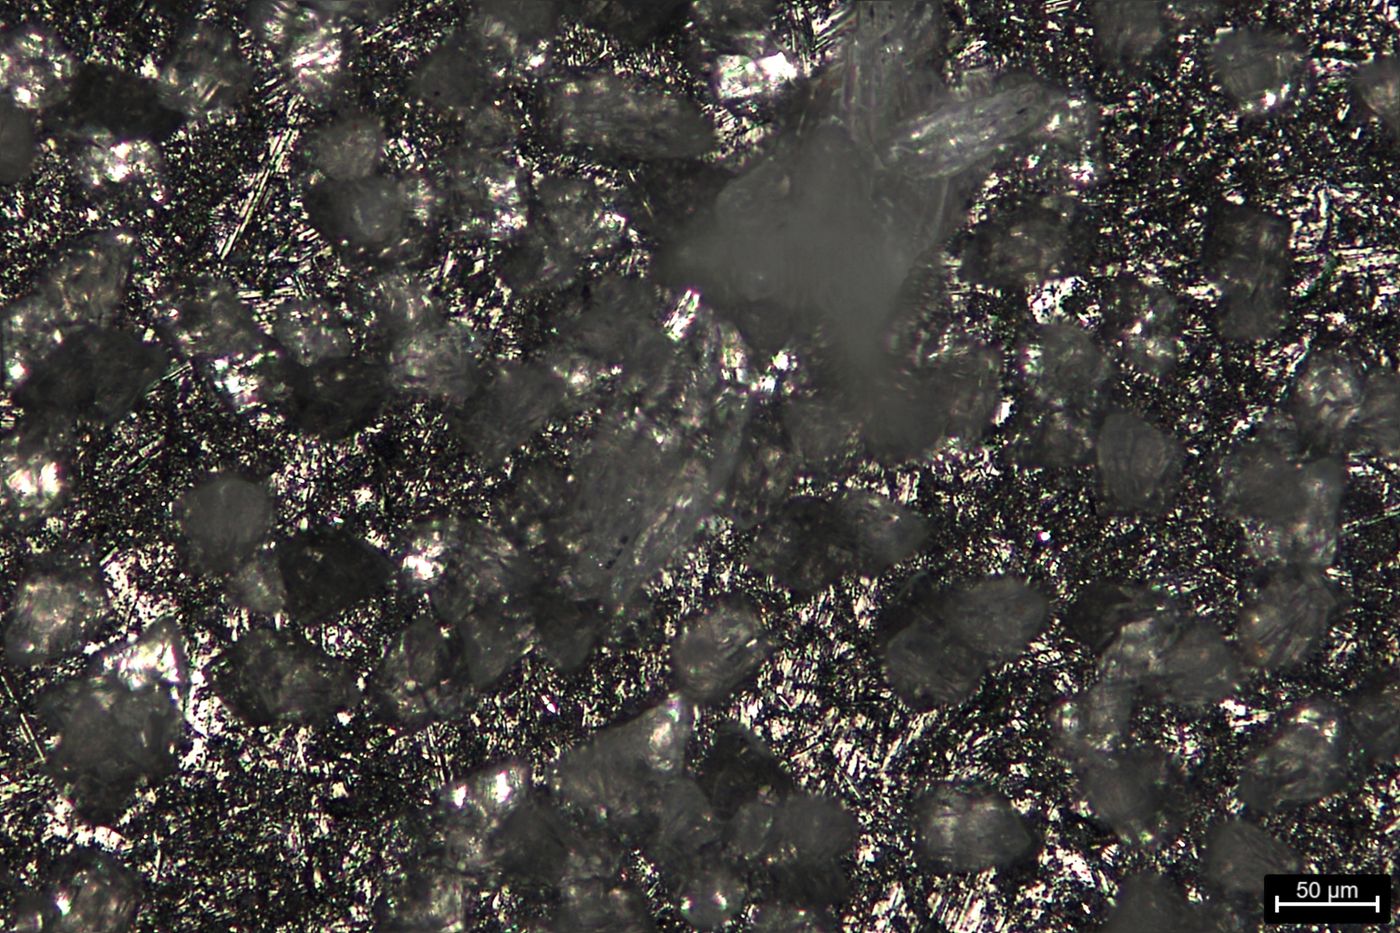
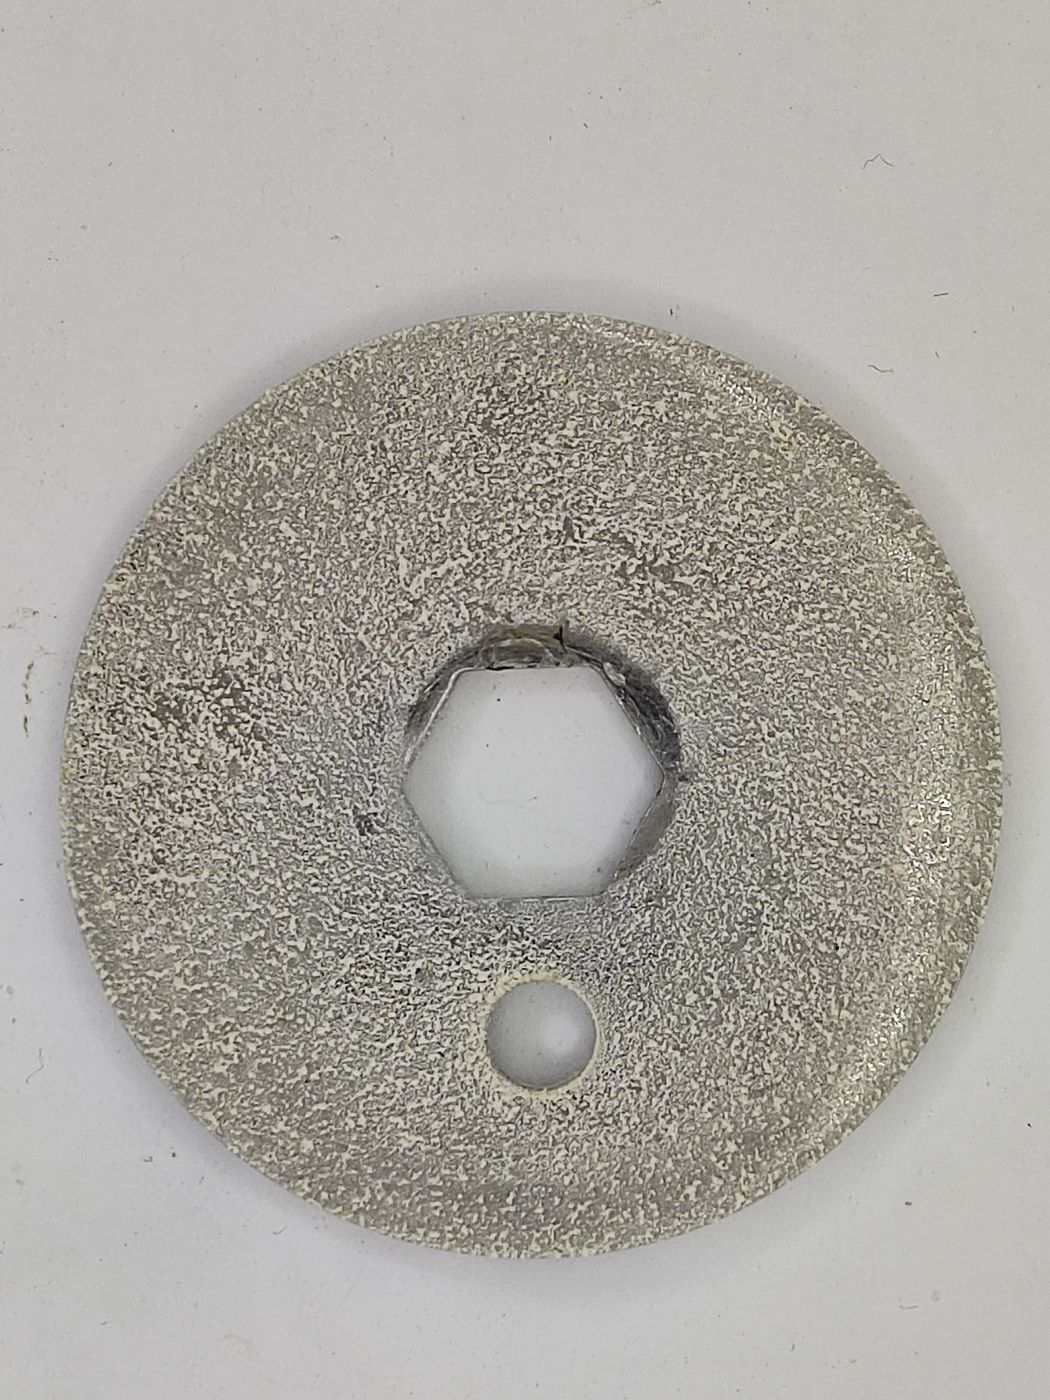
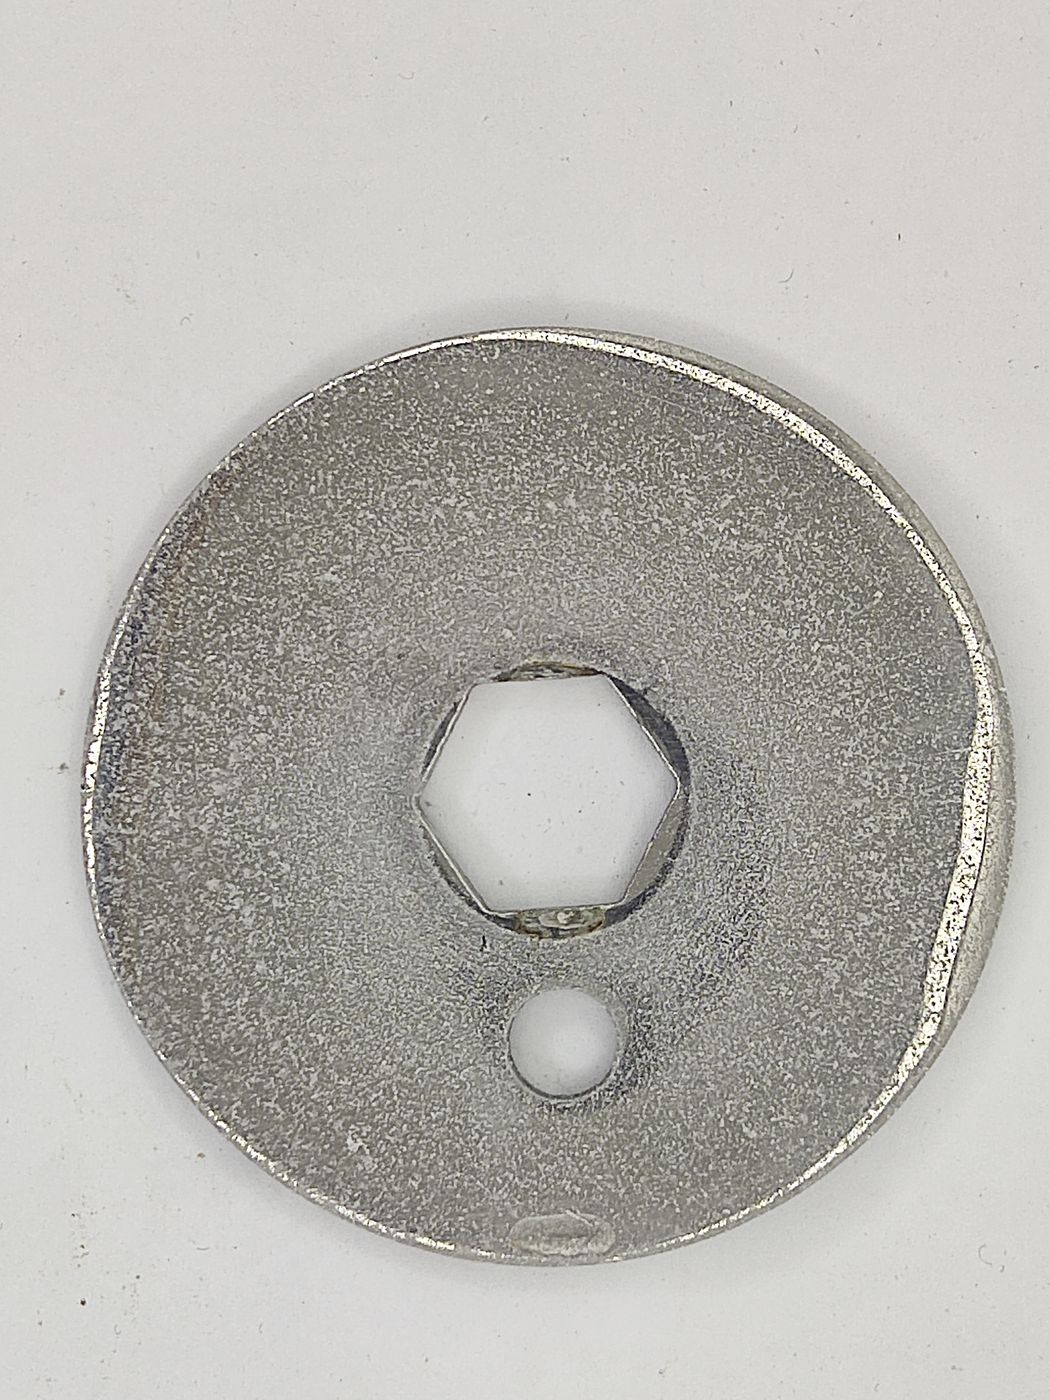
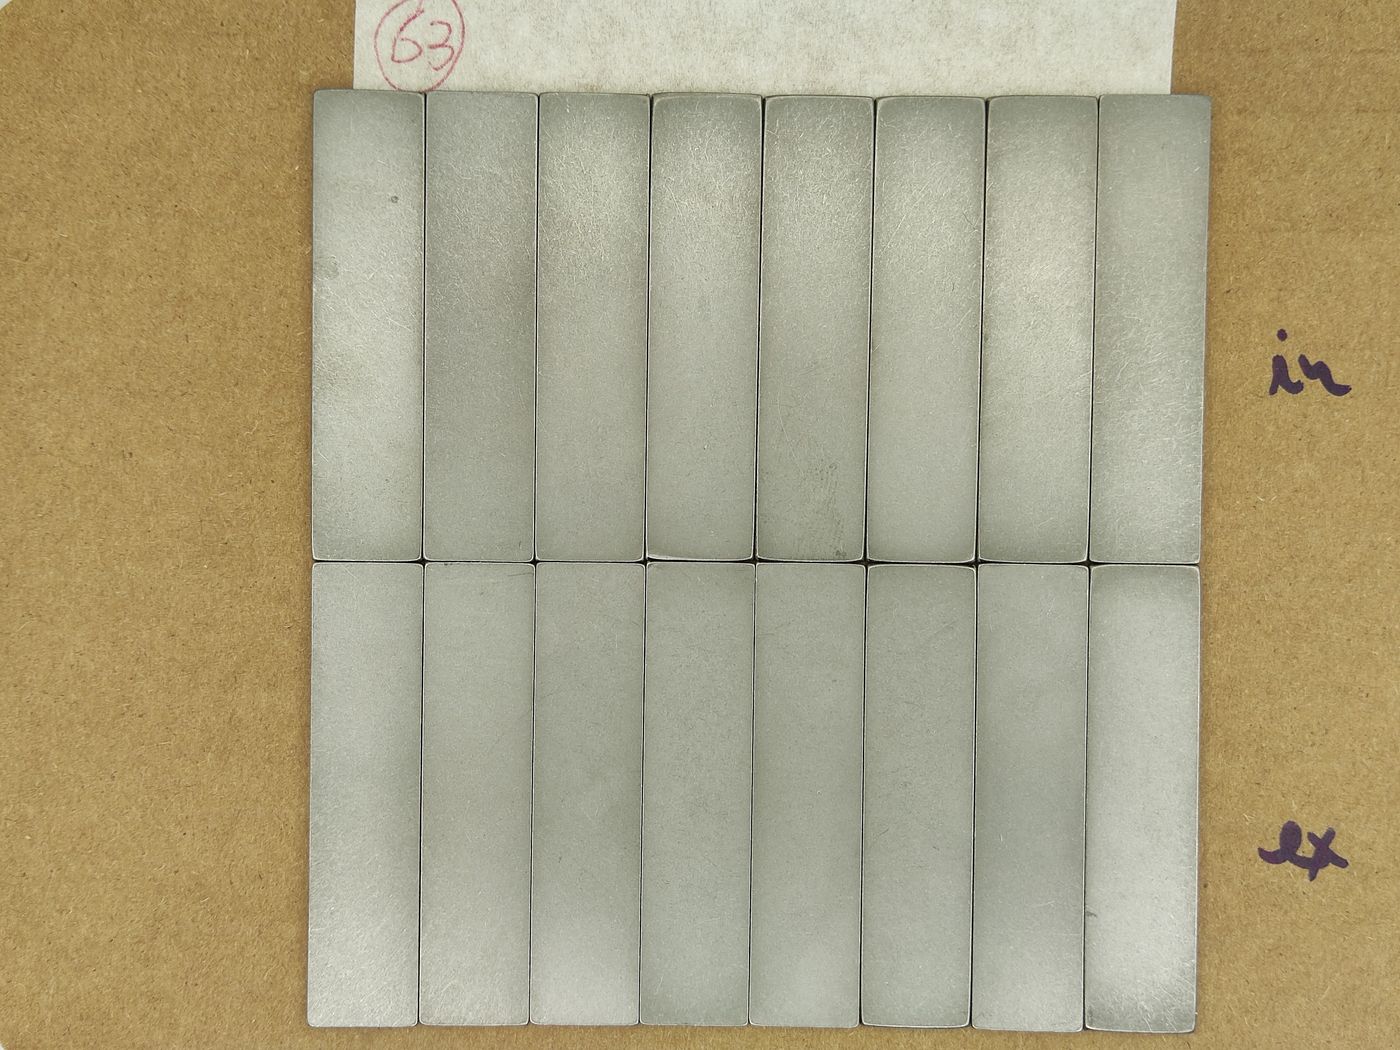
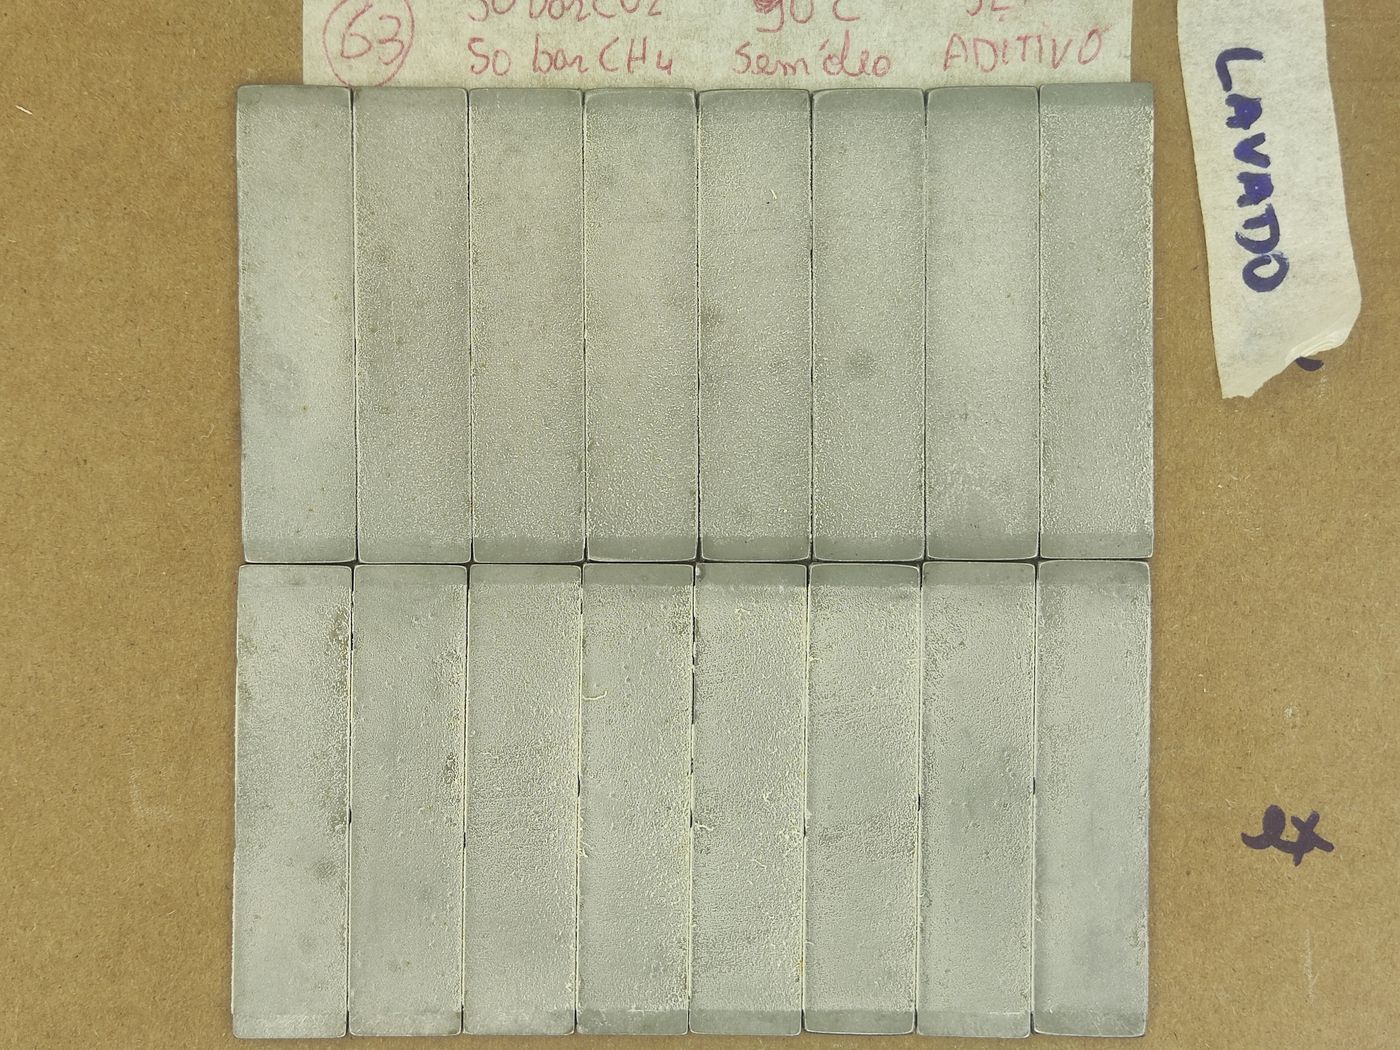
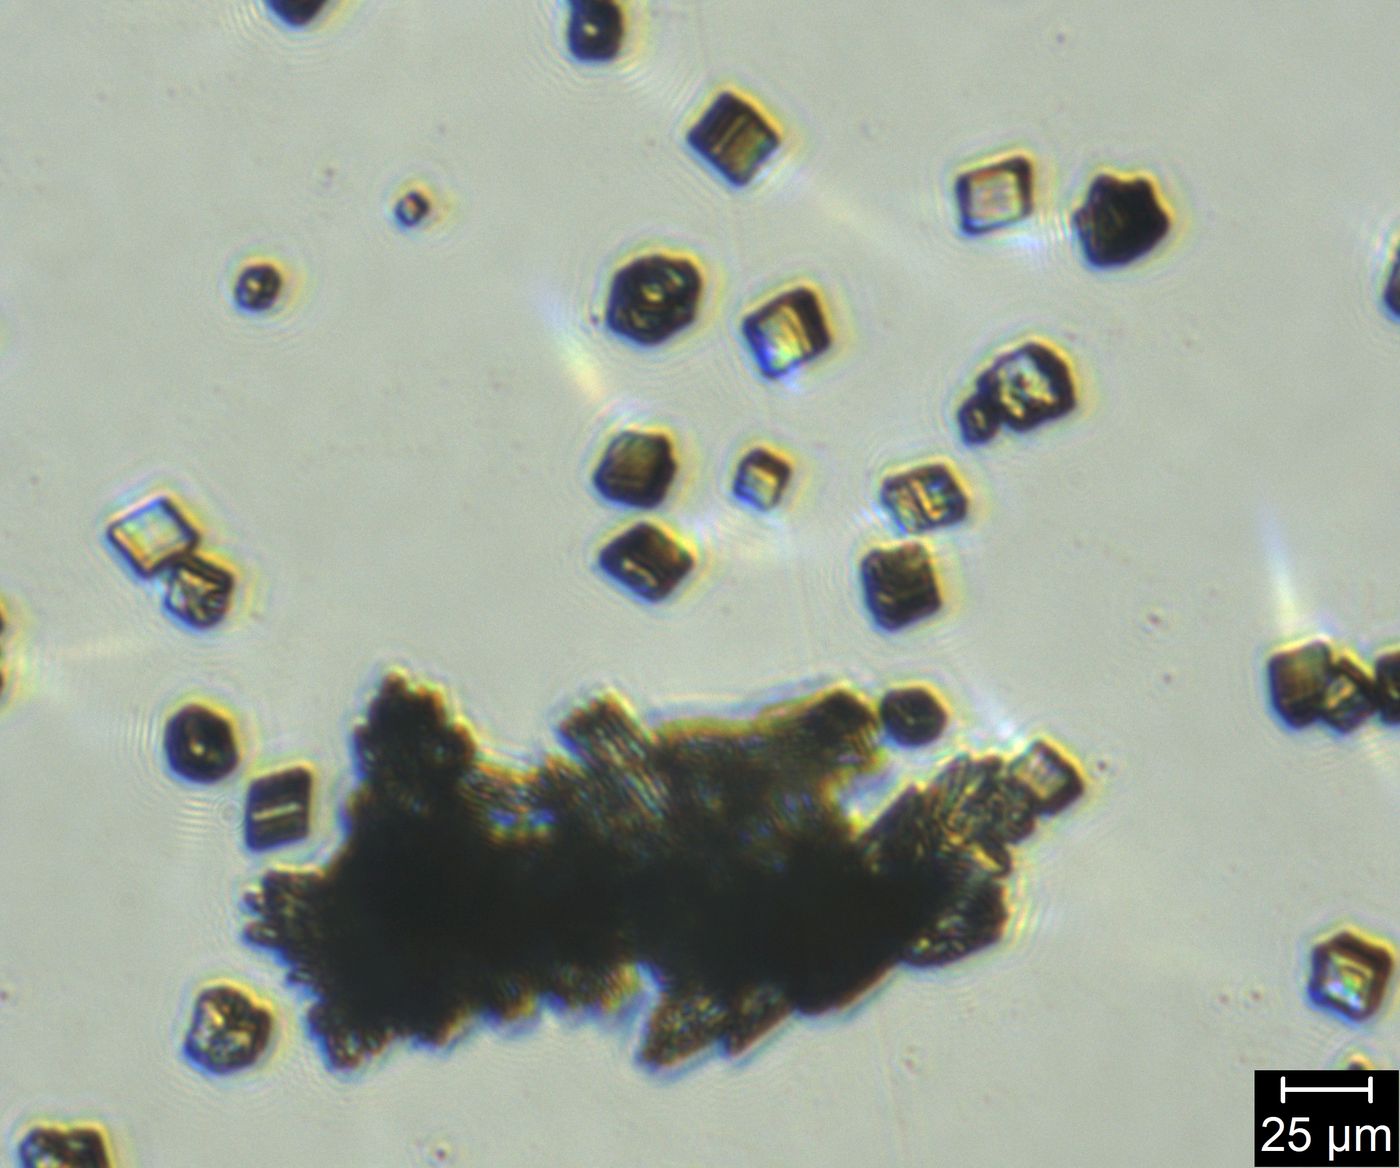
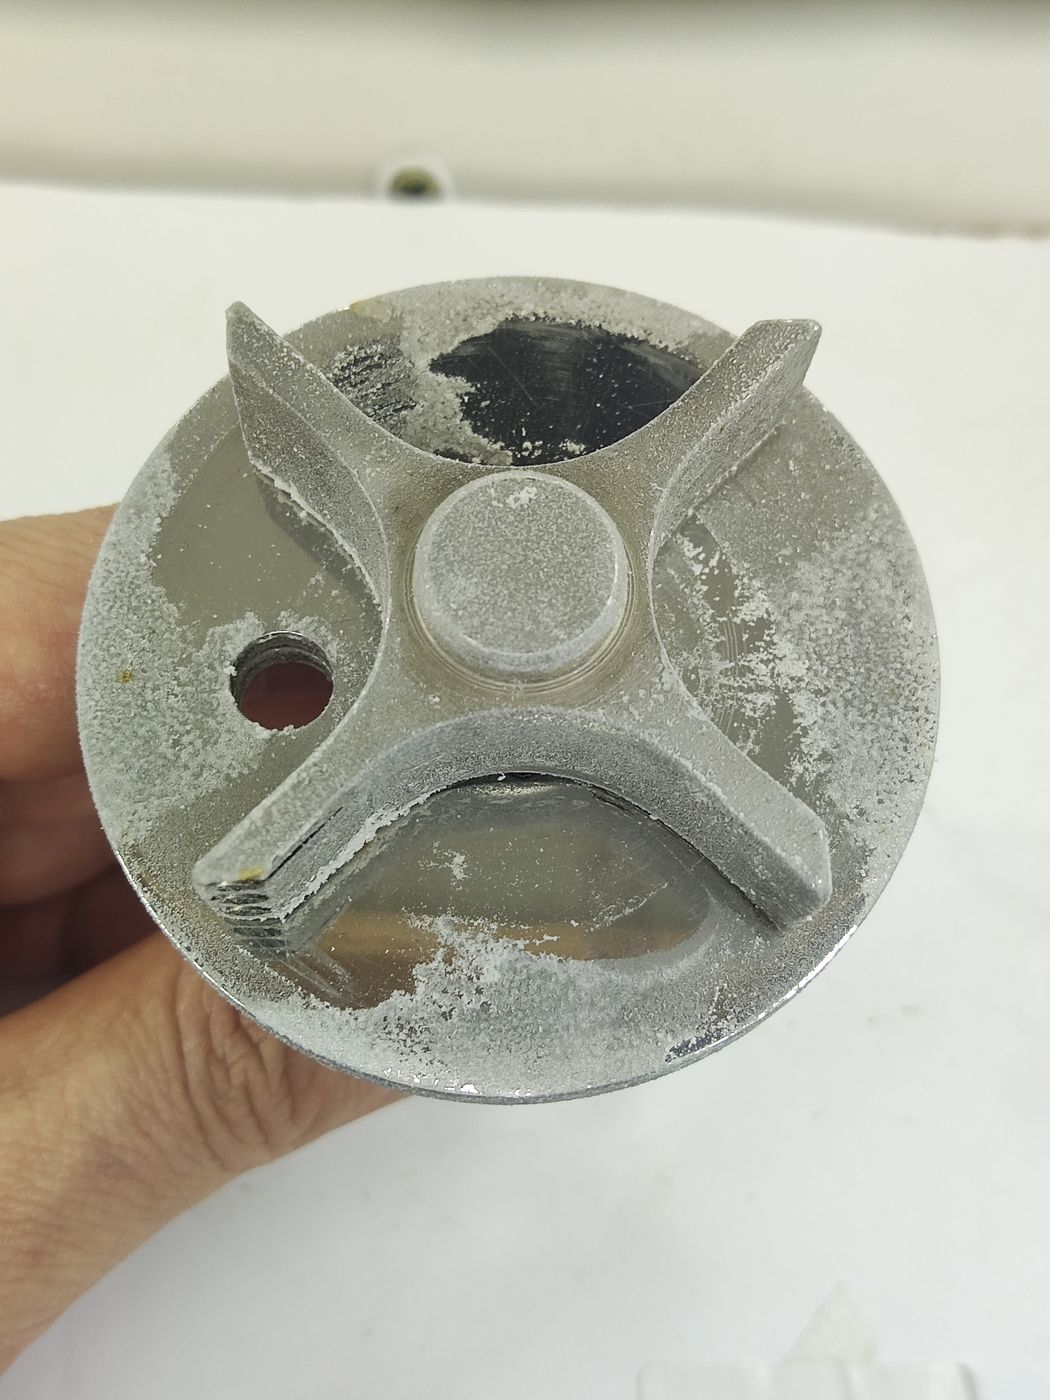
Photographs from two complementary tests run in the same reactor in May 2026 — test 63 (without additive) and test 64 (with antiscalant additive) — at 90 °C, 50 bar CO2 + 50 bar CH4, 125 rpm, with AISI 316L coupons. They are not part of the poster results; they show the same comparison with a CO2/CH4 gas mixture.
Coupons after the test
Crystals collected from the reactor (50 µm scale bar)
Internal coupon surface (50 µm scale bar)
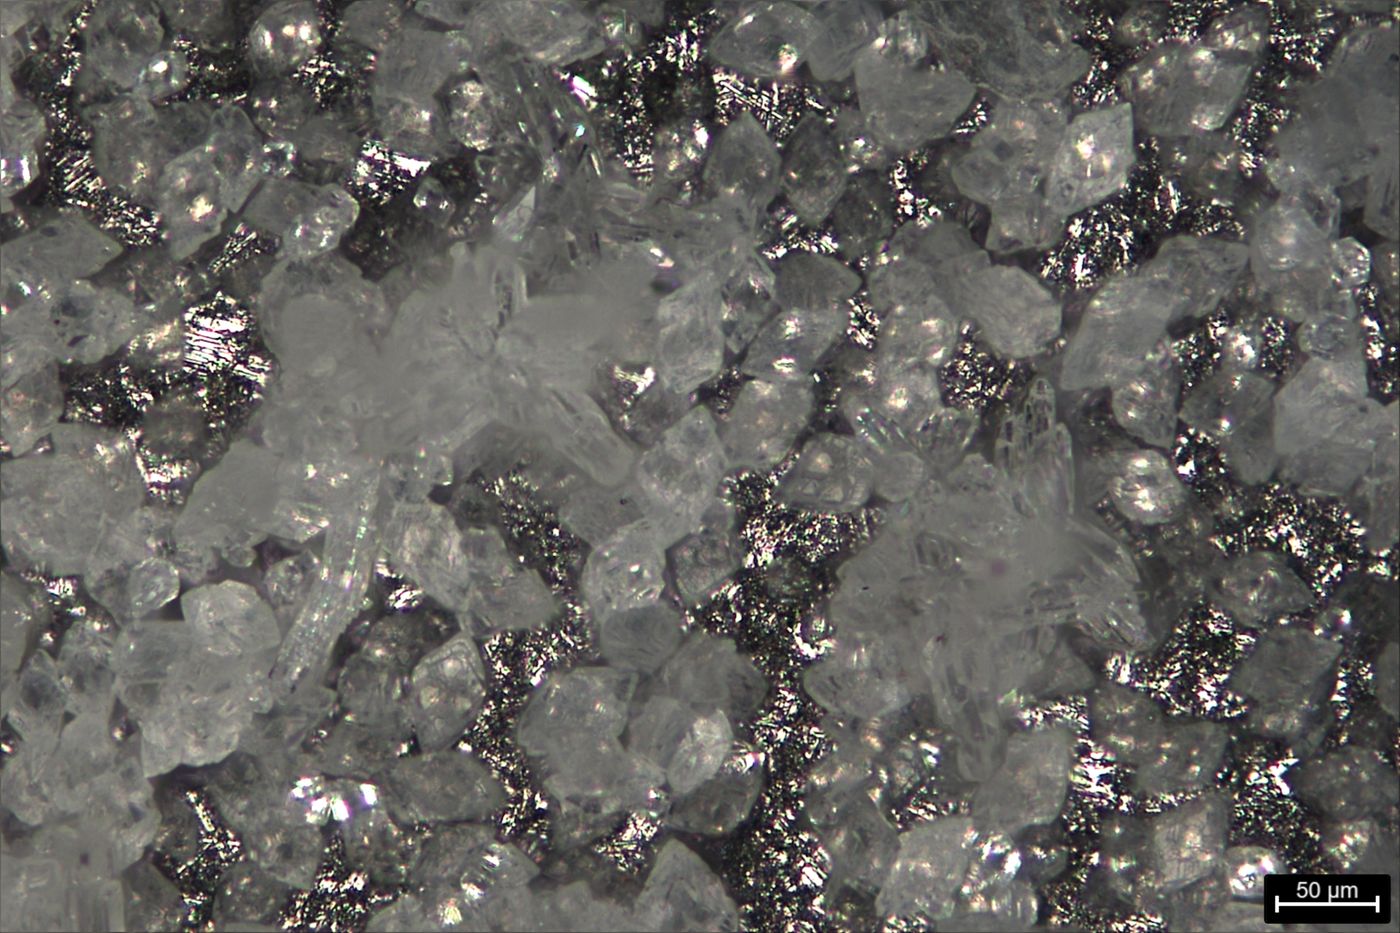
External coupon surface (50 µm scale bar)
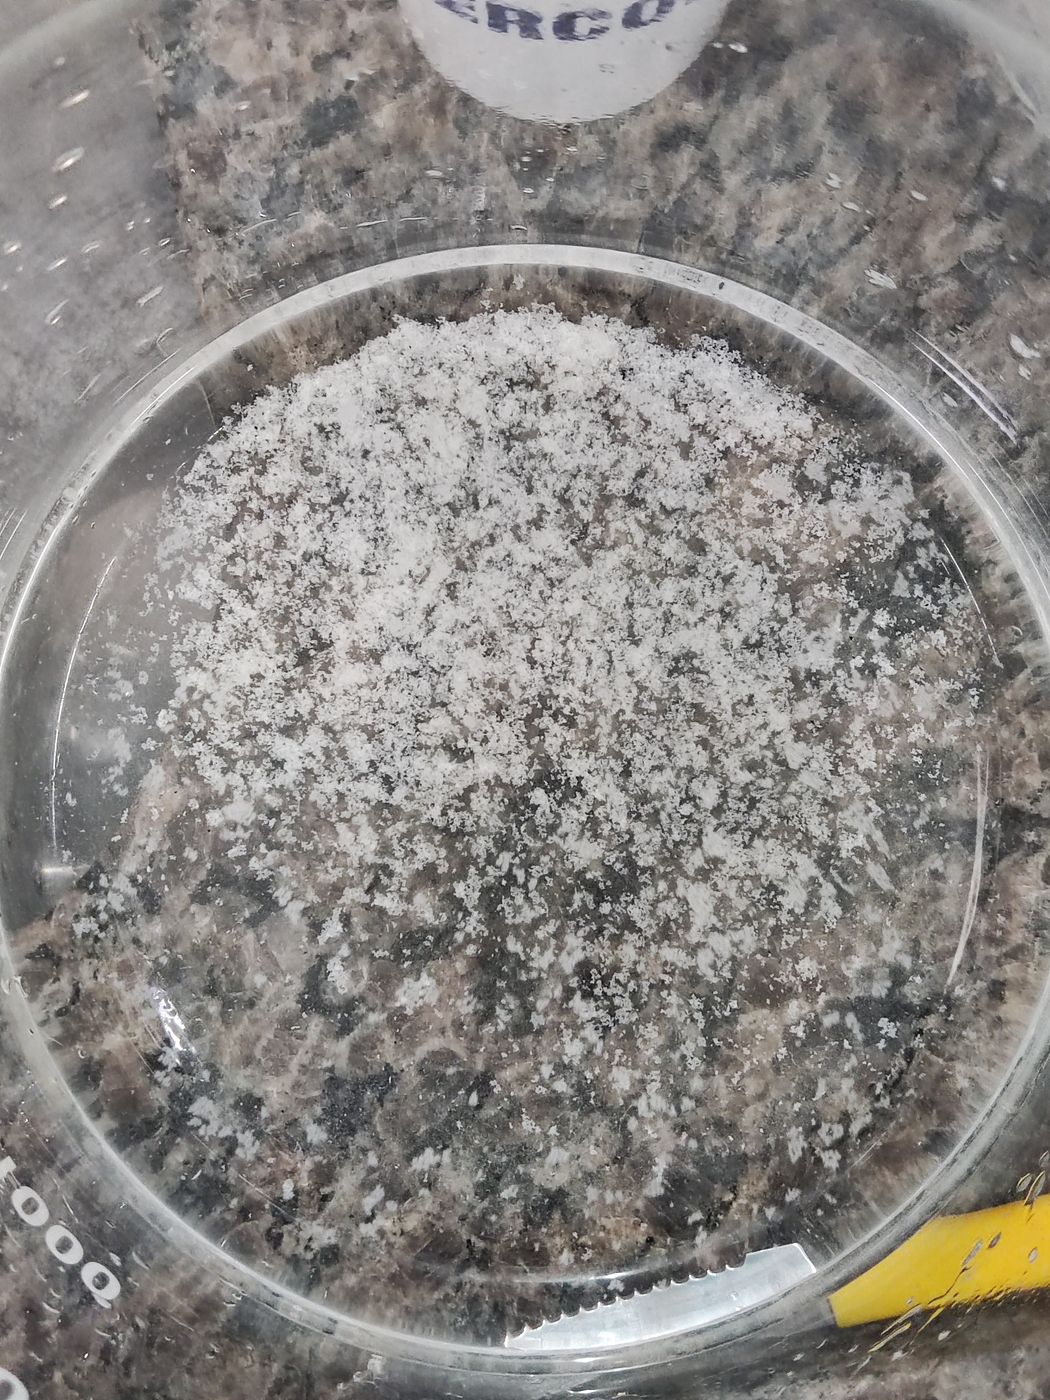
Rotating-cage disc after the test
References
- Tang, Y. et al., 2008. Investigation of CaCO3 scale inhibition by PAA, ATMP and PAPEMP. Desalination, 228, pp. 55–60.
- Wang, Z., Neville, A., Meredith, A. W., 2005. How and why does scale stick? SPE International Symposium on Oilfield Scale.
- Cosmo, R. P. et al., 2022. Modeling and validation of the CO2 degassing effect on CaCO3 precipitation using oilfield data. Fuel, 310(B), 122067. doi:10.1016/j.fuel.2021.122067
- Maciel, R. S. et al., 2025. Unraveling the hydrodynamic effects on CaCO3 scaling under HTHP CO2 degassing. Petroleum Science, 23, pp. 434–446. doi:10.1016/j.petsci.2025.09.040
Want to test your product or material?
Our HPHT reactor runs these tests under representative well conditions.